LASSO when conditioning on signs and active set
One of the first works in this line of conditional inference is Lee et al. which considers the LASSO (squared-error loss) and conditions on the active set and their signs.
[1]:
import numpy as np, pandas as pd
import matplotlib.pyplot as plt
import statsmodels.api as sm
%matplotlib inline

from selectinf.tests.instance import gaussian_instance # to generate the data
from selectinf.algorithms.api import lasso
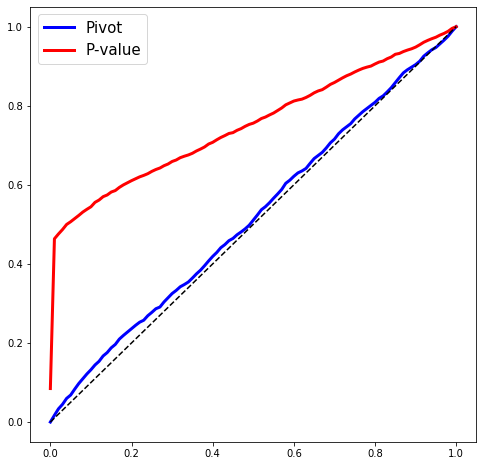
We will know generate some data from an OLS regression model and fit the LASSO with a fixed value of \(\lambda\). In the simulation world, we know the true parameters, hence we can then return pivots for each variable selected by the LASSO. These pivots should look (marginally) like a draw from np.random.sample. This is the plot below.
[2]:
np.random.seed(0) # for replicability

def simulate(n=500,
             p=100,
             s=5,
             signal=(5, 10),
             sigma=1):

    # description of statistical problem

    X, y, truth = gaussian_instance(n=n,
                                    p=p,
                                    s=s,
                                    equicorrelated=False,
                                    rho=0.,
                                    sigma=sigma,
                                    signal=signal,
                                    random_signs=True,
                                    scale=False)[:3]

    sigma_hat = np.linalg.norm(y - X.dot(np.linalg.pinv(X).dot(y))) / np.sqrt(n - p)
    L = lasso.gaussian(X, y, 2 * np.sqrt(n), sigma=sigma_hat)
    soln = L.fit()
    active_vars = soln != 0

    if active_vars[truth != 0].sum() == s: # ensure we have screened for ease of interpretation
        projected_truth = np.linalg.pinv(X[:, active_vars]).dot(X.dot(truth))
        S = L.summary(truth=projected_truth)
        S0 = L.summary()

        pivot = S['pval'] # these should be pivotal
        pvalue = S0['pval']
        return pd.DataFrame({'pivot':pivot,
                             'pvalue':pvalue})
Let’s take a look at what we get as a return value:
[3]:
while True:
    df = simulate()
    if df is not None:
        break
df.columns
[3]:
Index(['pivot', 'pvalue'], dtype='object')
[4]:
dfs = []
for i in range(200):
    df = simulate()
    if df is not None:
        dfs.append(df)
[5]:
results = pd.concat(dfs)
import statsmodels.api as sm
thresh = 0.001 # POSSIBLE BUG? several very small pivots -- fine for pvalues
grid = np.linspace(0, 1, 101)
fig = plt.figure(figsize=(8, 8))
plt.plot(grid, sm.distributions.ECDF(results['pivot'][results['pivot'] > thresh])(grid), 'b-', linewidth=3, label='Pivot')
plt.plot(grid, sm.distributions.ECDF(results['pvalue'])(grid), 'r-', linewidth=3, label='P-value')
plt.plot([0, 1], [0, 1], 'k--')
plt.legend(fontsize=15);

[ ]: